Mixed fiscal years
Apple’s year ends in September, NVIDIA’s in January. Blend them and the comparison is quietly wrong.
✓Finance CLI Every value keeps its period end date.
Financial research tools for AI agents
Finance CLI gives your agent tools to retrieve SEC filings, normalize periods and units, calculate metrics, and keep the source behind every important number. You ask the question. Your agent decides how to investigate it.
pip install finresearch-cliOpen source · Runs locally · SEC research needs no paid key
| Fiscal year | Services | Share | Share chart |
|---|---|---|---|
| FY2020 | $53.8B | 19.6% | |
| FY2021 | $68.4B | 18.7% | |
| FY2022 | $78.1B | 19.8% | |
| FY2023 | $85.2B | 22.2% | |
| FY2024 | $96.2B | 24.6% | |
| FY2025 | $109.2B | 26.2% |
Source: Apple Form 10-K filings, FY2022 and FY2025 (fiscal years end in late September). Values reported in $ millions; share = Services ÷ net sales. Each year links to its filing. Retrieved by an agent with Finance CLI on September 30, 2026.
How Exhibit 1 was made
Seven CLI calls: find the filings, read the statements, check overlapping years for restatements, confirm units, and calculate. Sixty seconds, no editing of the numbers.
The output
This is what the agent produced in the video above, using real CLI output. Open each tab to see the evidence, the tool calls, the arithmetic, and what the filings don’t say.
Read the full Apple case study →“Has Apple become more dependent on Services over the last five years? Is growth coming from Services or hardware? Give me each year’s numbers and sources.”
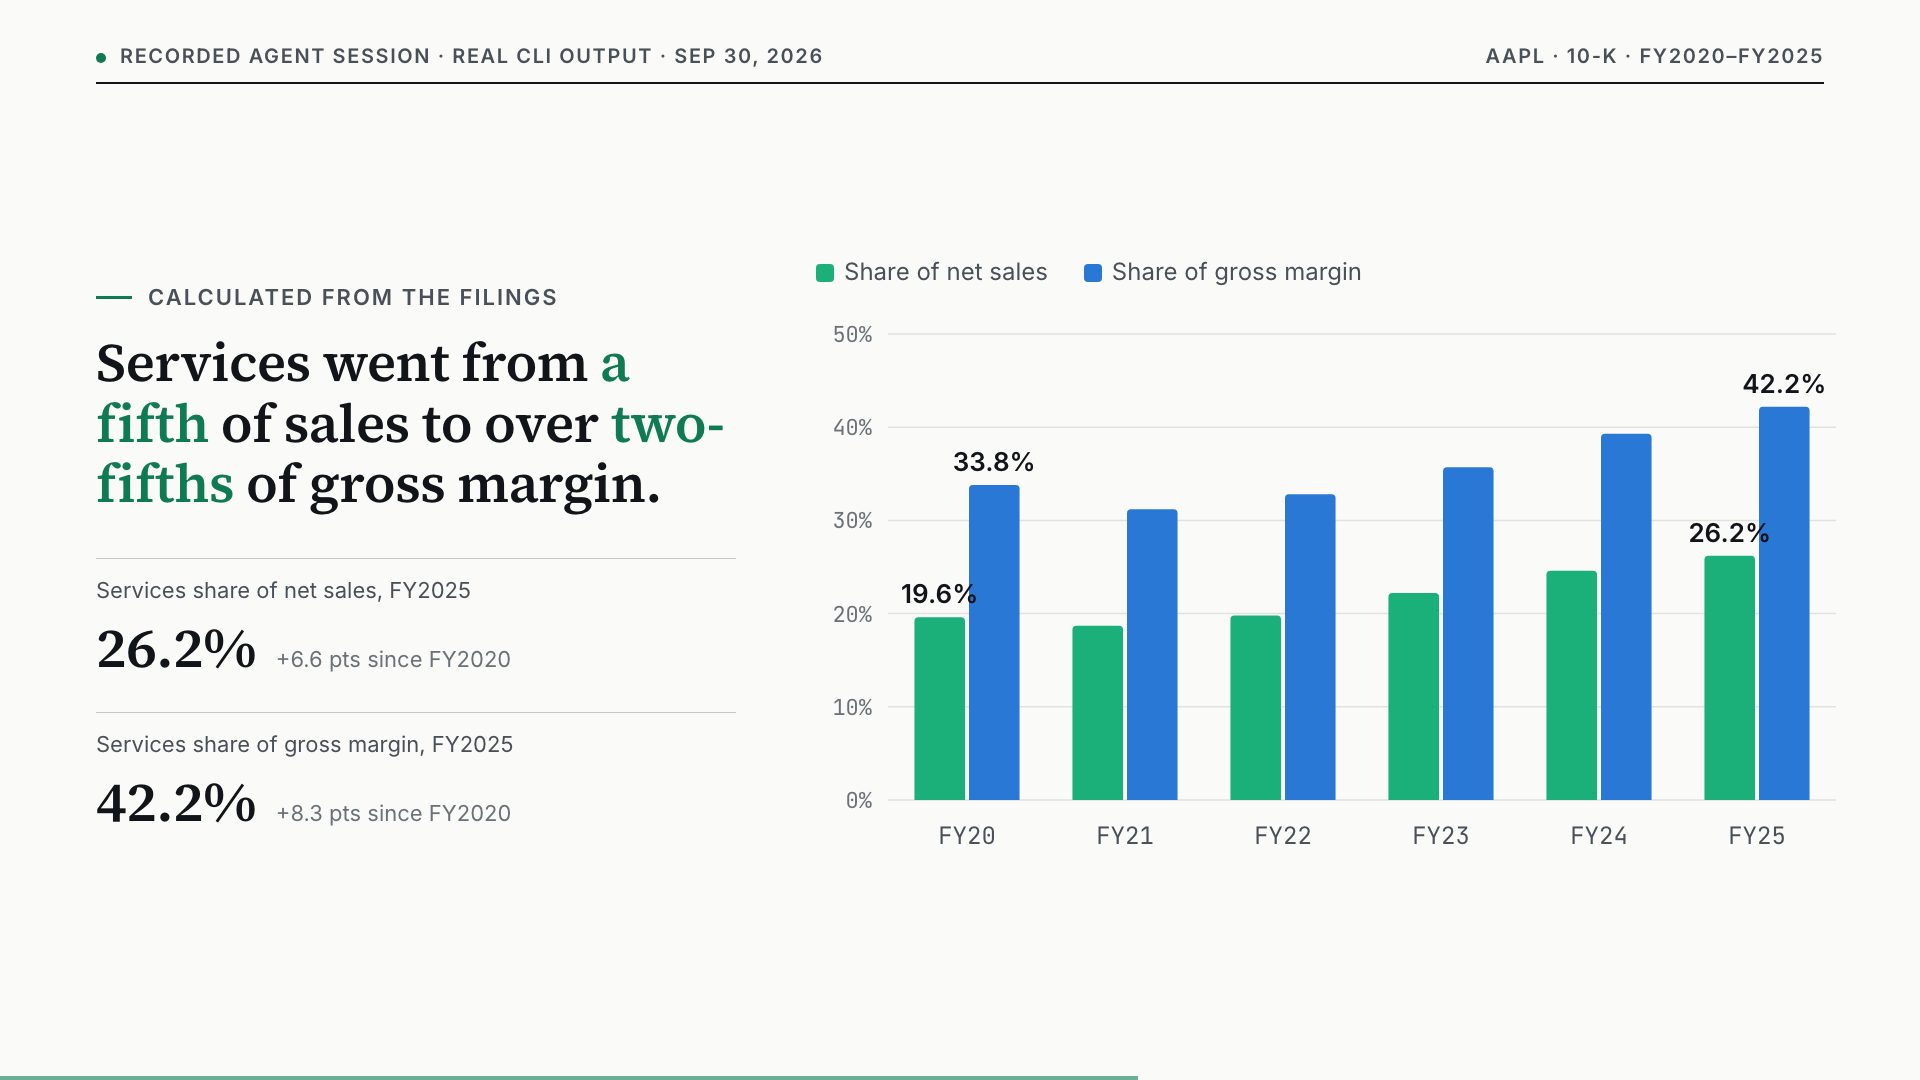
Yes. Services rose from 19.6% of net sales in FY2020 to 26.2% in FY2025. Its share of gross margin rose faster, from 33.8% to 42.2%, because Services gross margin was 75.4% in FY2025.
Where the growth came from depends on the window. Since FY2022, Products net sales changed by −$9.2B while Services added $31.0B, so Services accounts for all of the net growth. Over the full five years, Products still added more dollars ($86.3B vs $55.4B), most of it in the FY2021 rebound.
Services compounded at 15.2% a year from FY2020 to FY2025, against 6.8% for Products.
| Fiscal year | Services | Net sales | Services share | Share of gross margin | Source |
|---|---|---|---|---|---|
| FY2020 | $53.8B | $274.5B | 19.6% | 33.8% | 10-K · 0000320193-22-000108 |
| FY2021 | $68.4B | $365.8B | 18.7% | 31.2% | 10-K · 0000320193-22-000108 |
| FY2022 | $78.1B | $394.3B | 19.8% | 32.8% | 10-K · 0000320193-22-000108 |
| FY2023 | $85.2B | $383.3B | 22.2% | 35.7% | 10-K · 0000320193-25-000079 |
| FY2024 | $96.2B | $391.0B | 24.6% | 39.3% | 10-K · 0000320193-25-000079 |
| FY2025 | $109.2B | $416.2B | 26.2% | 42.2% | 10-K · 0000320193-25-000079 |
Apple net sales by category. Fiscal years end on the last Saturday of September. Values reported in millions of US dollars.
filings.recentList annual reports so every fiscal year maps to one specific filing.finance filings.recent AAPL forms=10-K limit=6 --output json 6 annual reports, FY2020–FY2025, each with an accession number.
Raw CLI output ↗filings.statementRead Products and Services net sales and cost of sales for FY2023–FY2025.finance filings.statement accession=0000320193-25-000079 statement=income --output json Products and Services rows for FY2023–FY2025 with XBRL concepts.
Raw CLI output ↗filings.statementRead the same rows for FY2020–FY2022 from the earlier 10-K.finance filings.statement accession=0000320193-22-000108 statement=income --output json The same rows for FY2020–FY2022.
Raw CLI output ↗filings.statementCross-check overlapping years: did a later filing restate FY2022 or FY2021?finance filings.statement accession=0000320193-23-000106 statement=income --output json FY2021 and FY2022 values match the earlier filing. No restatement.
Raw CLI output ↗filings.reportConfirm units ($ in millions) and the product-category breakdown in the revenue note.finance filings.report accession=0000320193-25-000079 name="Revenue - Disaggregated Net Sales and Portion of Net Sales That Was Previously Deferred (Details)" --output json Revenue note is in $ millions. Services is reported as one line.
Raw CLI output ↗filings.readFind management's explanation of what drove Services growth.finance filings.read accession=0000320193-25-000079 section=mda max_chars=60000 --output json Management names advertising, the App Store and cloud services as drivers.
Raw CLI output ↗formula.marginCompute shares and growth with stated inputs and method.finance formula.margin numerator=109158 denominator=416161 18 ratios and 2 CAGRs, each with inputs. FY2025 Services share = 26.23%.
Services net sales / Net salesFY2025: 109,158,000,000 / 416,161,000,000= 26.23%(Services sales − Services cost of sales) / total gross marginFY2025: 82,314,000,000 / 195,201,000,000= 42.17%(end / start) ** (1 / periods) − 153,768,000,000 → 109,158,000,000, 5 periods= 15.21%FY2021 and FY2022 Products and Services figures in the FY2023 10-K match the FY2022 10-K exactly.
The two categories sum to reported net sales in all six years.
Services net sales include amortization of the deferred value of services bundled in the sales price of certain products.
Services net sales increased during 2025 compared to 2024 primarily due to higher net sales from advertising, the App Store and cloud services. The filing gives no amount for each driver.
Why not just let the agent browse?
Apple’s year ends in September, NVIDIA’s in January. Blend them and the comparison is quietly wrong.
✓Finance CLI Every value keeps its period end date.
Statements, notes and websites scale numbers differently. One slip changes the answer by 1,000×.
✓Finance CLI Raw XBRL values, with the unit stated.
Later filings can revise earlier years. A copied number may no longer be the reported one.
✓Finance CLI Overlapping years cross-checked across filings.
A ratio with no inputs can’t be checked, so it can’t be trusted.
✓Finance CLI Calculations return inputs and method.
Showcase
Each session is a real question answered from real filings. The tool calls, raw CLI output and calculations are published, so you can check every step or rerun it.
Financial statement analysis
Services grew from 19.6% to 26.2% of net sales — and 42.2% of gross margin.
Cross-company comparison
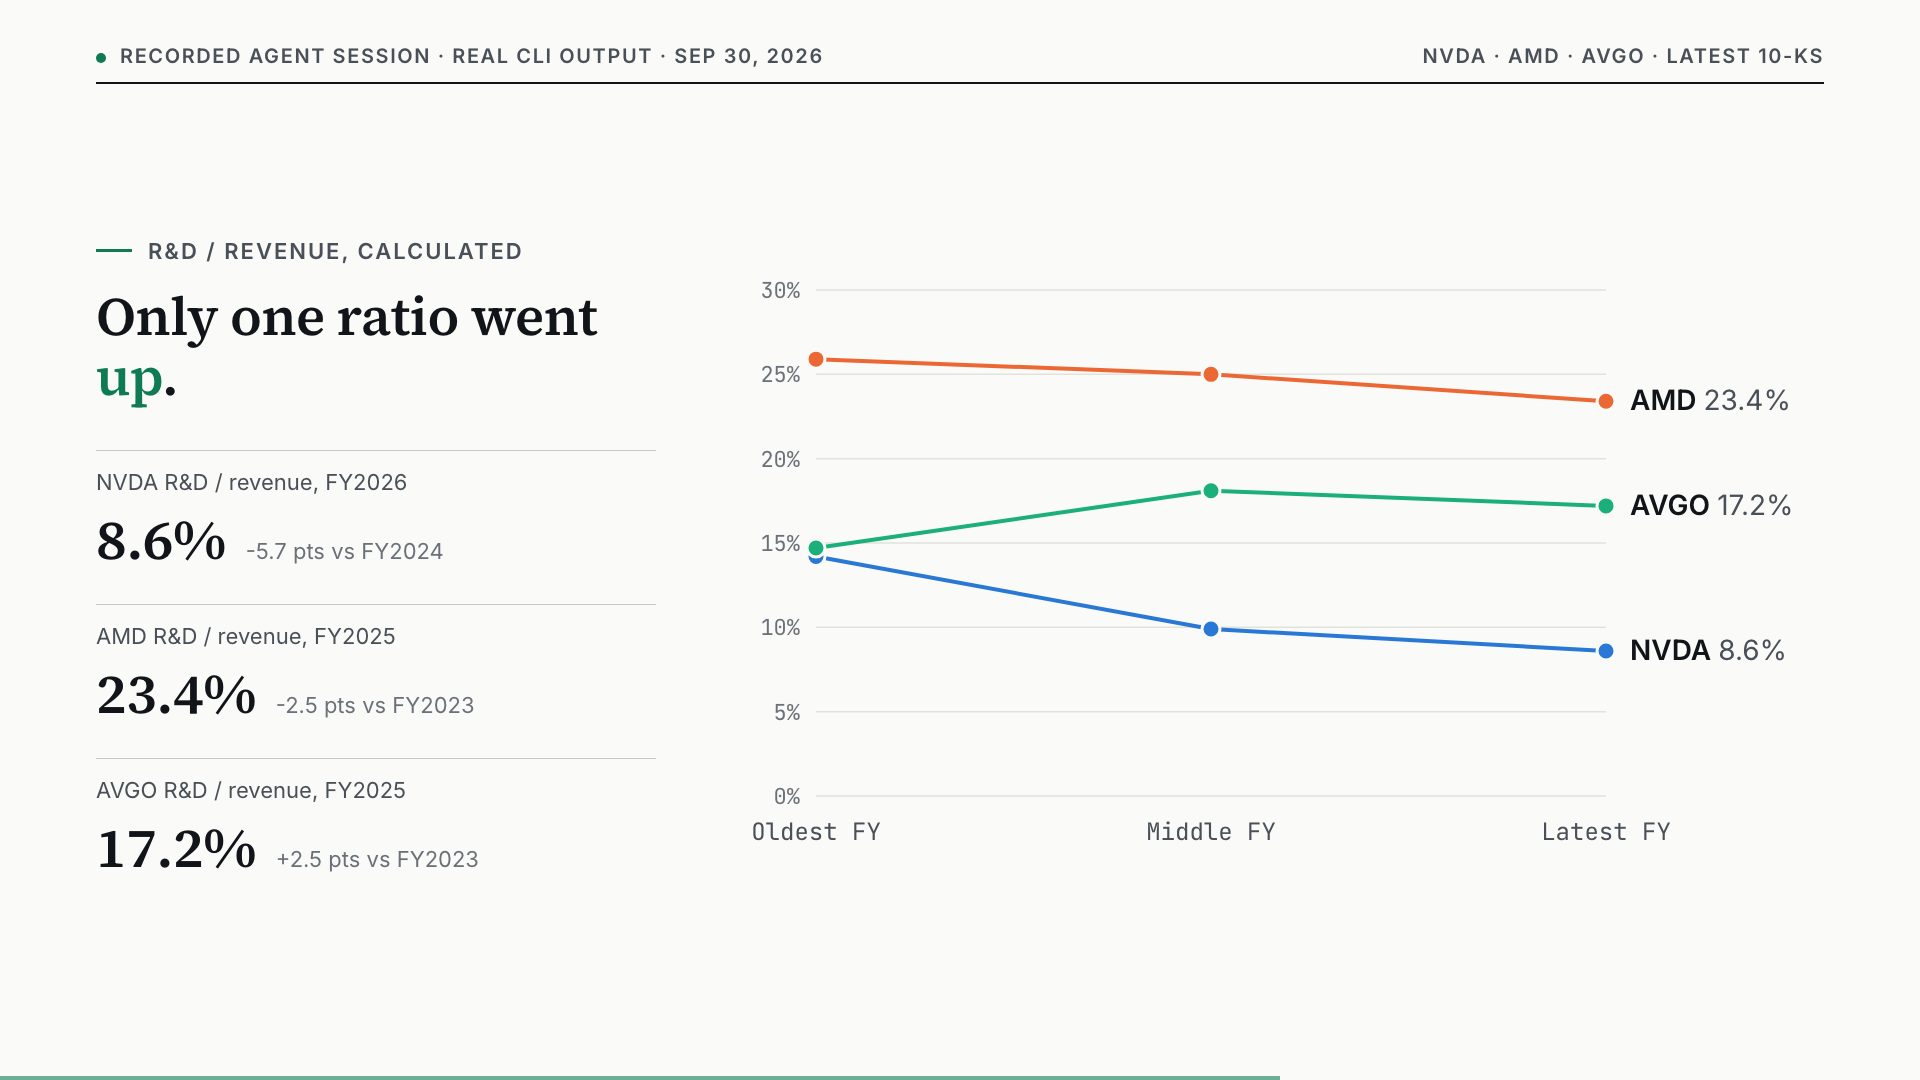
Only Broadcom’s R&D intensity rose (+2.5 pts), and an acquisition explains it. NVIDIA grew R&D fastest in dollars while its ratio fell.
Open-ended investigation
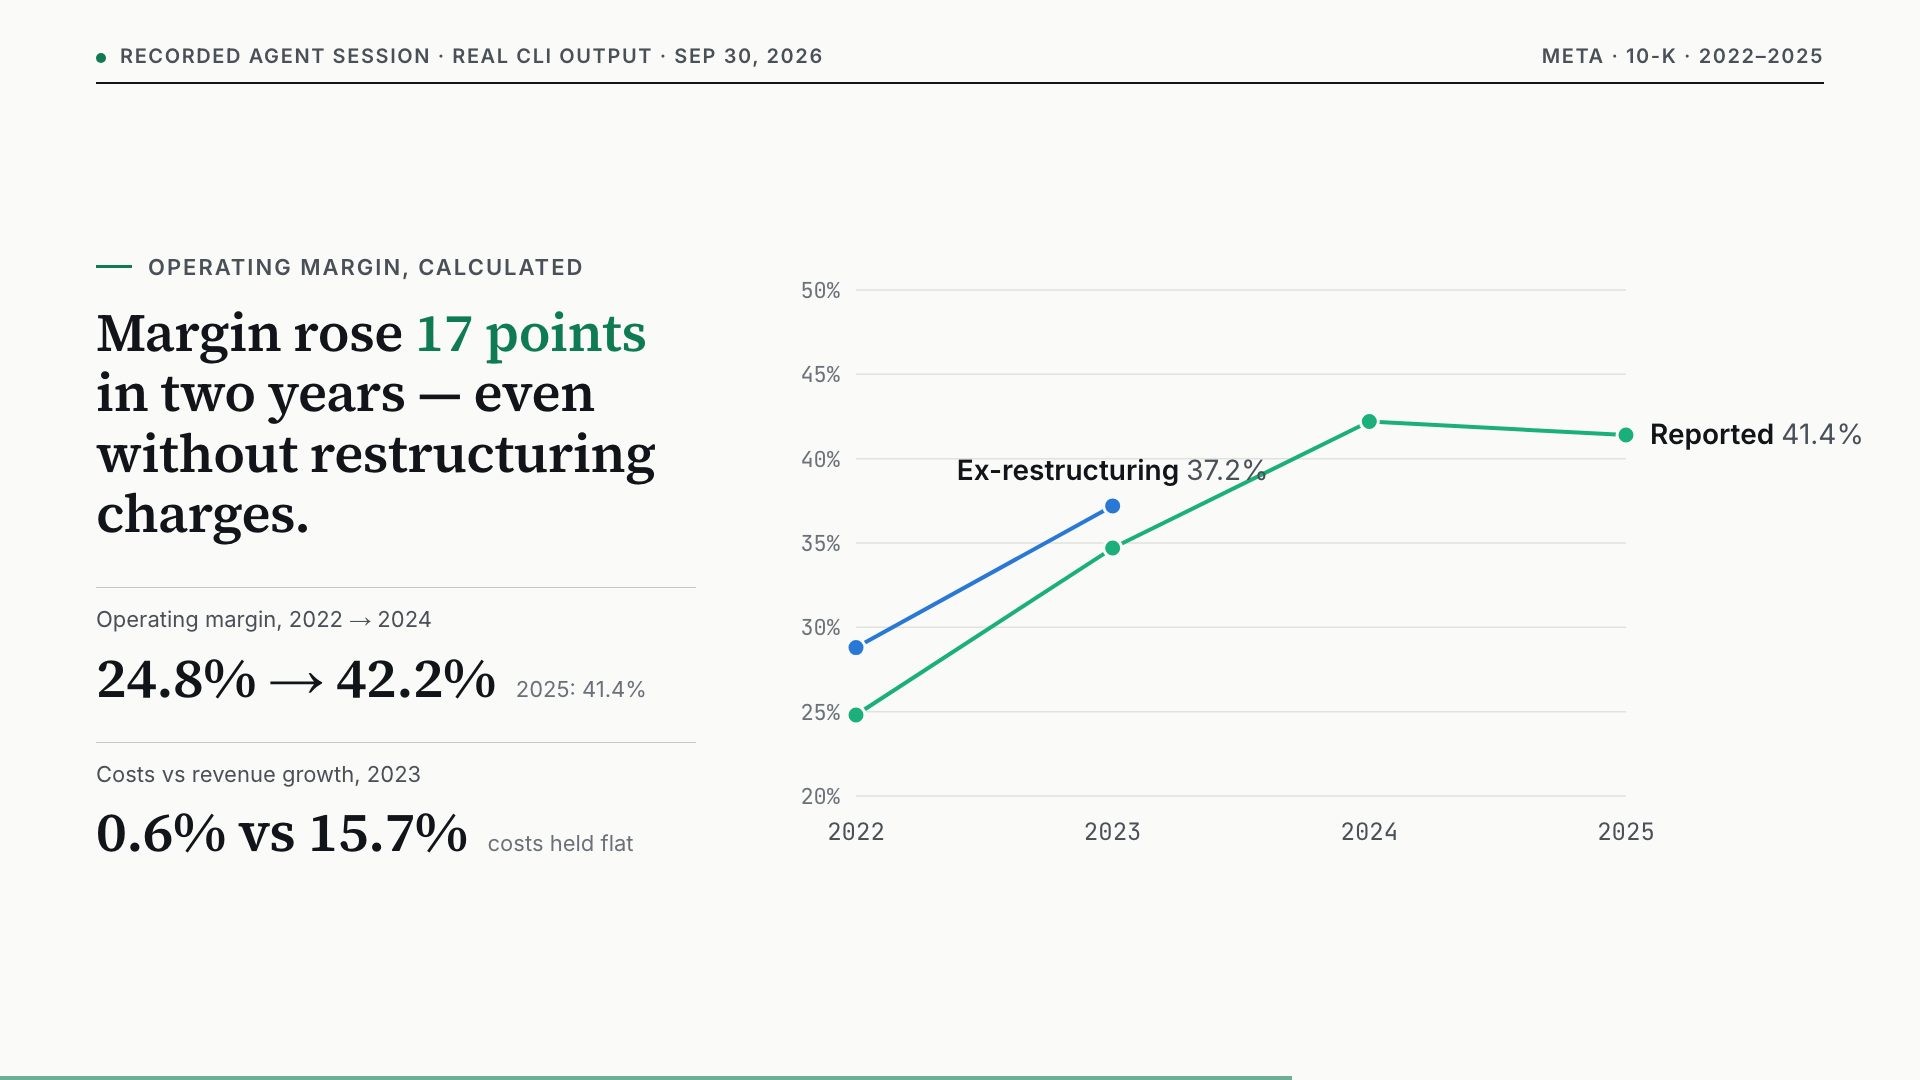
Operating margin went from 24.8% to 42.2% in two years. Excluding restructuring charges, the improvement still holds.
Thesis → evidence
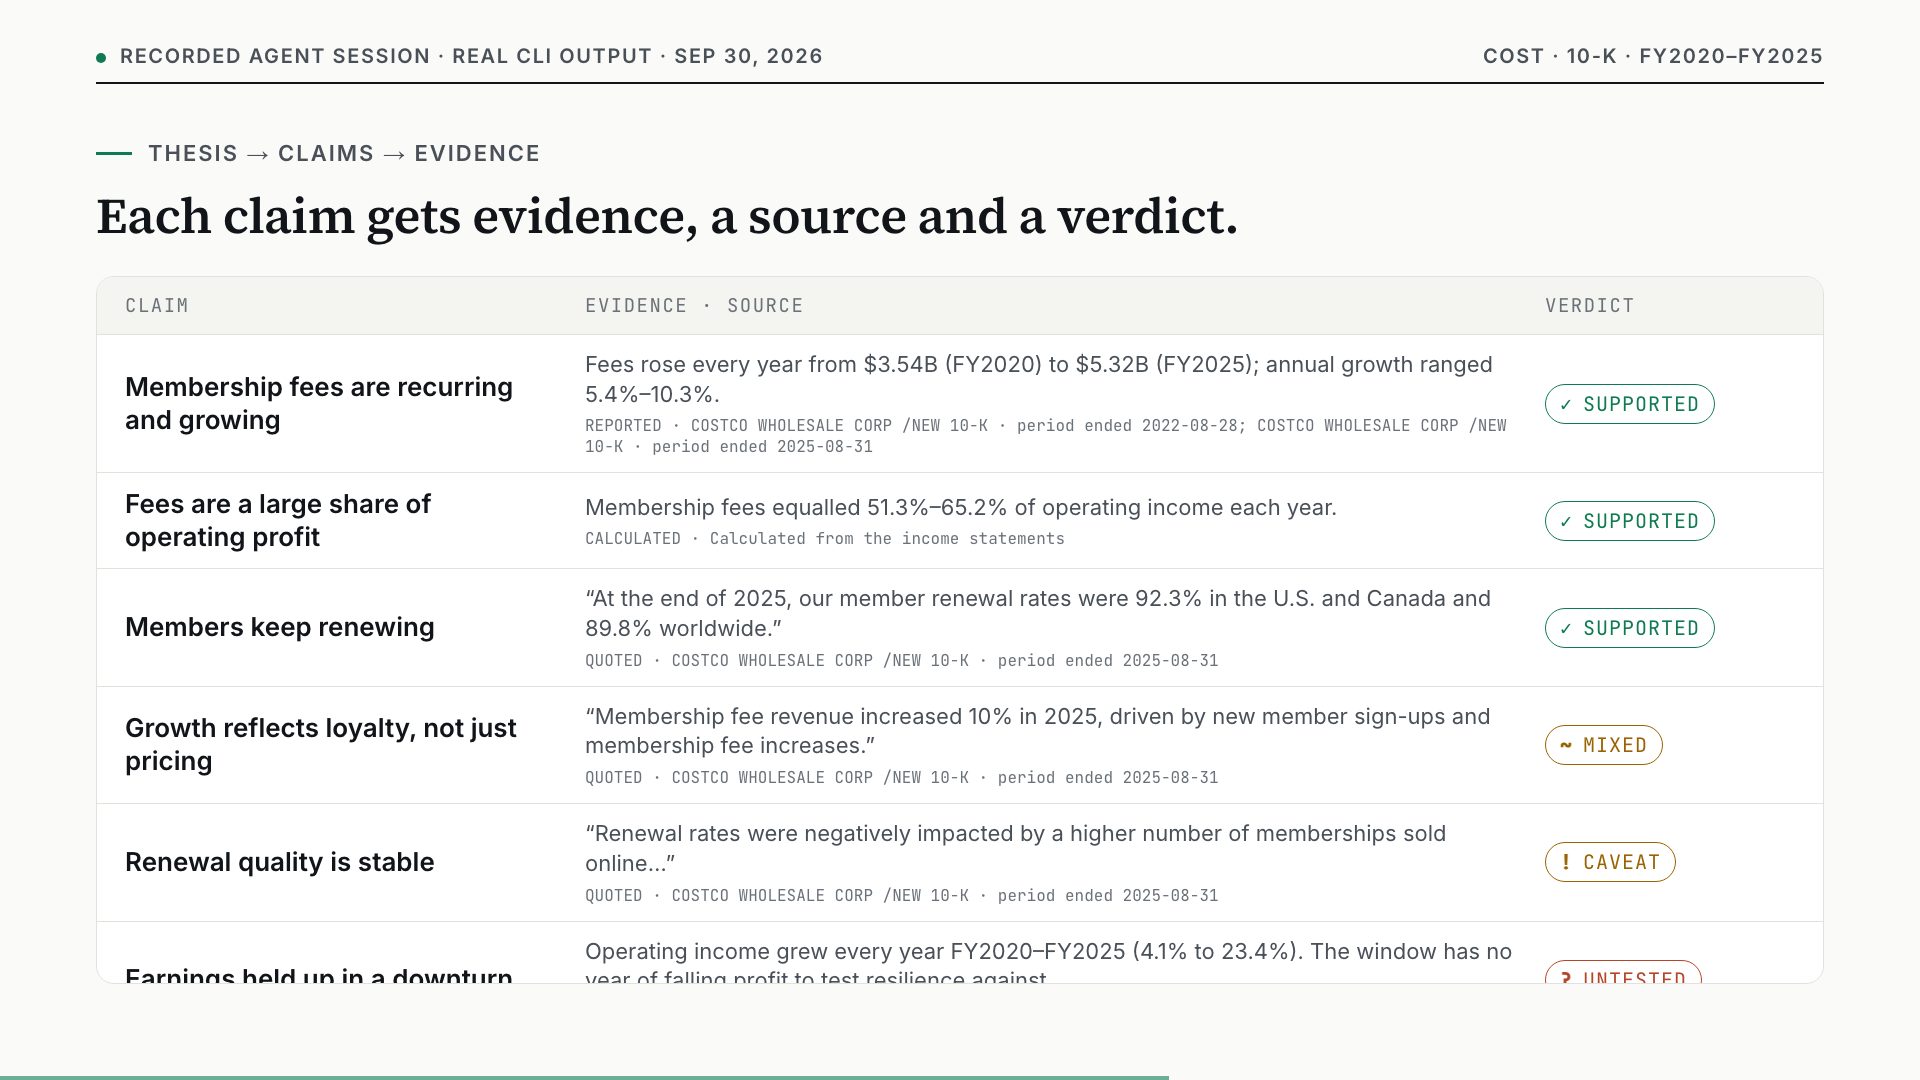
Partly supported: fees equal 51% of operating income and renewals stay near 90%, but six years of rising profit can’t test resilience.
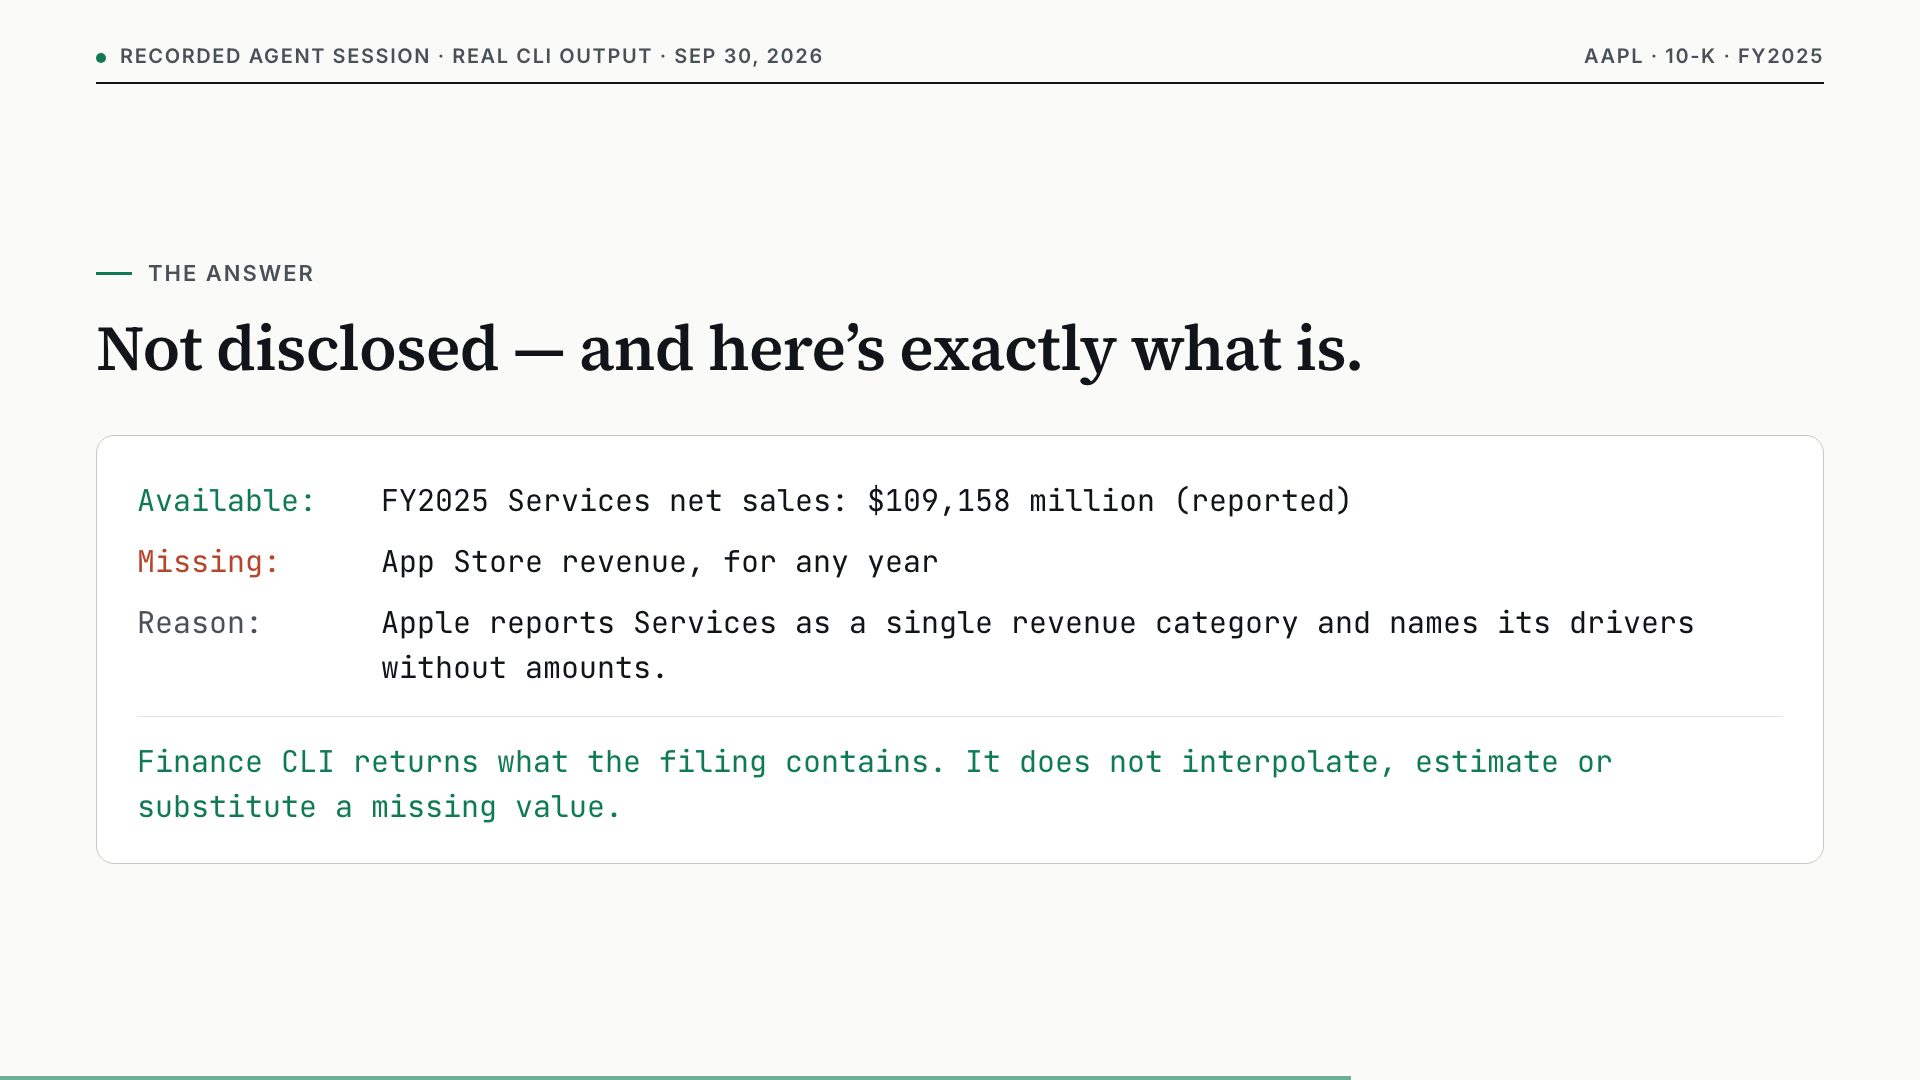
Missing data, reported honestly
The 10-K doesn’t disclose it. The right answer says so.
Missing data, reported honestly
Finance CLI helps agents tell missing data from zero, an undisclosed figure from a failed retrieval, and reported values from calculated ones.
See how the agent checked“How much revenue does Apple’s App Store generate each year?”
Finance CLI returns what the filing contains. It does not interpolate, estimate or substitute a missing value.
Get started
You need an agent that can run terminal commands, such as Claude Code or Codex. Finance CLI runs locally; SEC research needs no paid key.
Python 3.10 or later. Then give SEC your name and email, as its fair-access policy asks.
macOS / Linux
python -m pip install -U finresearch-cli
export FINANCE_SEC_USER_AGENT="Your Name you@example.com"
Windows (PowerShell)
py -m pip install -U finresearch-cli
$env:FINANCE_SEC_USER_AGENT="Your Name you@example.com"
It teaches your agent which tools to use and how to cite them. Paste this into your agent:
Download https://tempestshaw.github.io/FinanceCLI/skills/finance-cli-skills.zip, extract it, copy the skills/finance-cli folder into my local agent skills directory, and verify it contains SKILL.md.
Then compare its answer with the recorded session. Services share of net sales, FY2025: 26.2%.
Expect 5–10 minutes and 30–40 tool calls. Your agent will ask to run finance commands; allow them.
Use Finance CLI to test whether Apple has become more dependent on Services over the last five fiscal years. Use 10-K income statements, keep fiscal-year end dates and units, check overlapping years for restatements, calculate the Services share of net sales and gross margin, and cite the accession for every figure. Say what the filings do not disclose.
Detailed setup for each agent: AI integration guide · Quick start · Or run the same tools yourself: finance filings.statement AAPL statement=income --output md